Within Crimson we have multiple solutions, accelerators and apps than can enable us to start projects exceedingly quickly and to ‘hit the ground running’, with the ultimate end game, of saving our customers time, effort and, of course, money.
One of the accelerators is a Health and Safety solution that can be configured to any customer specific H&S assessment requirements, and can allow assessments to be taken on a mobile phone or tablet, and can also allow for notes, photos and signatures to be easily added.
In Part 1 and Part 2 in this series I have been demonstrating how to build forms suitable for mobile and tablet devices. In this blog we conclude this mini project.
If you look at the difference between the web and mobile version, the forms can be designed to be radically different:
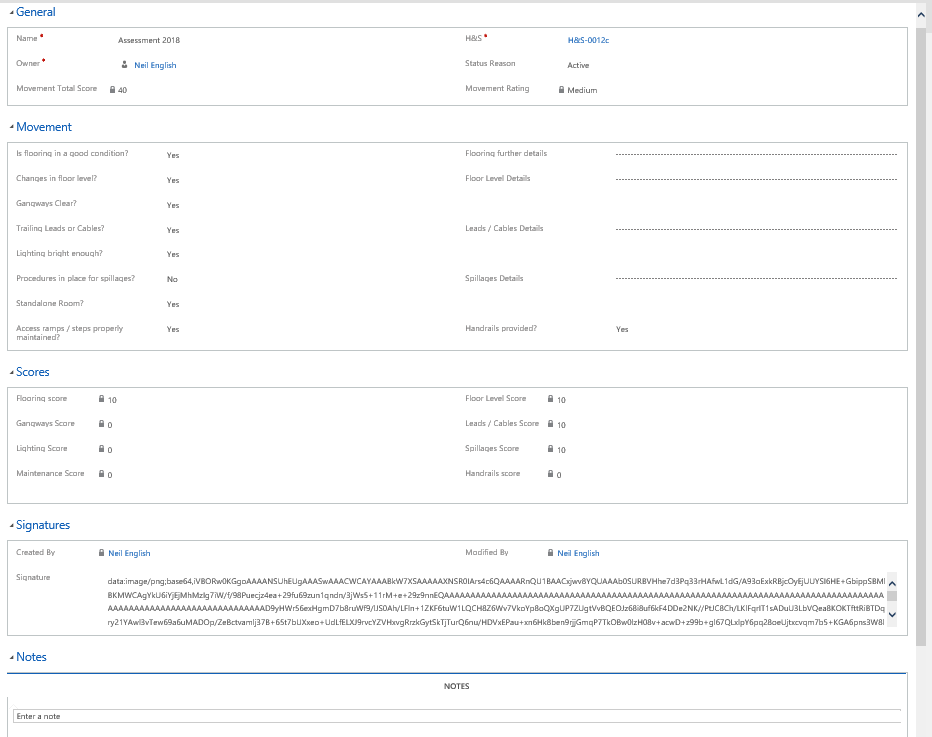
This form displays the header, movement, scores and notes sections. There are business rules that will show / hide fields based on provided answers, with automated scoring fields based on these answers and a signature section (as discussed in the previous blog).
Mobile Form
However, if this form is looked at in a mobile or tablet view you can see immediate noticeable differences:
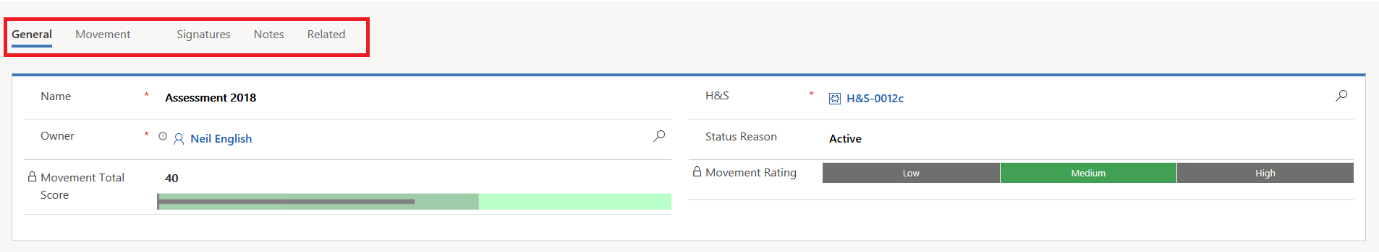
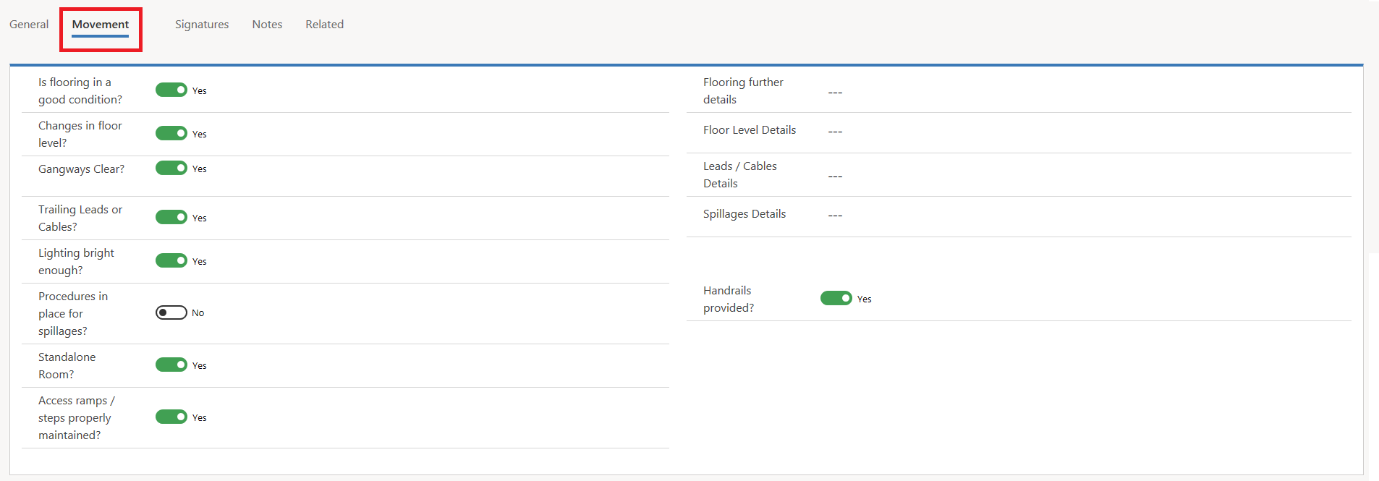
Note the highlighted section by tab is a lot more user friendly. As you can see above the Movement Score Total is a locked field, as is the Movement Rating. These values are based on scoring in the below section (the Movement section in the above highlighted image):
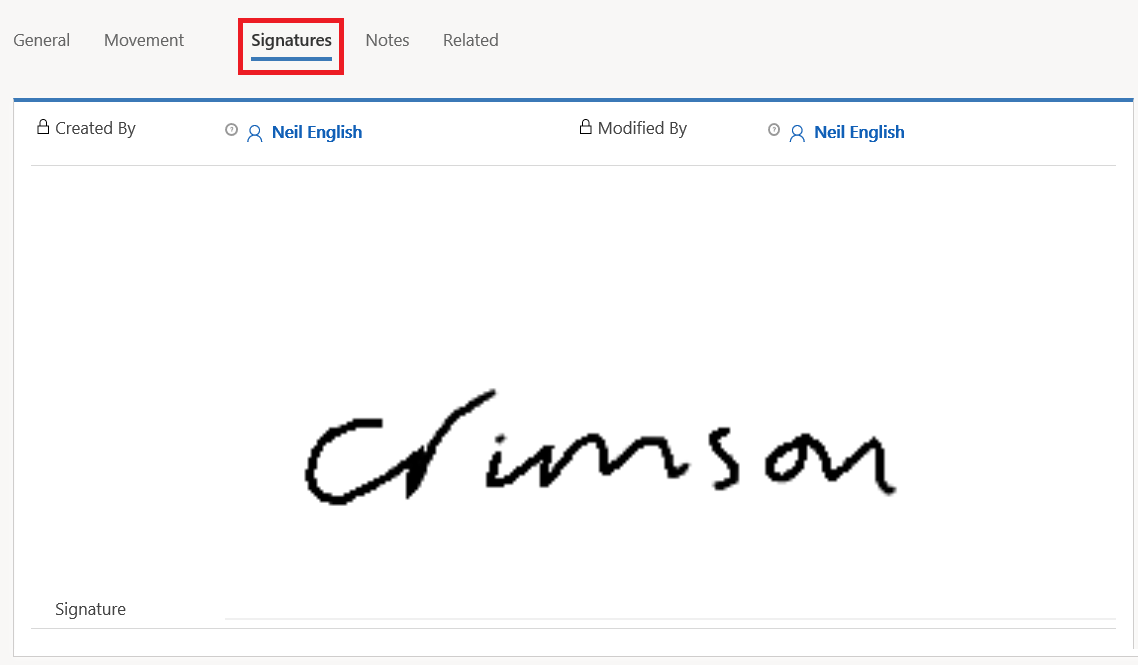
The Signature Section:
And finally the Notes section will allow you to record videos and take photos from the mobile app:
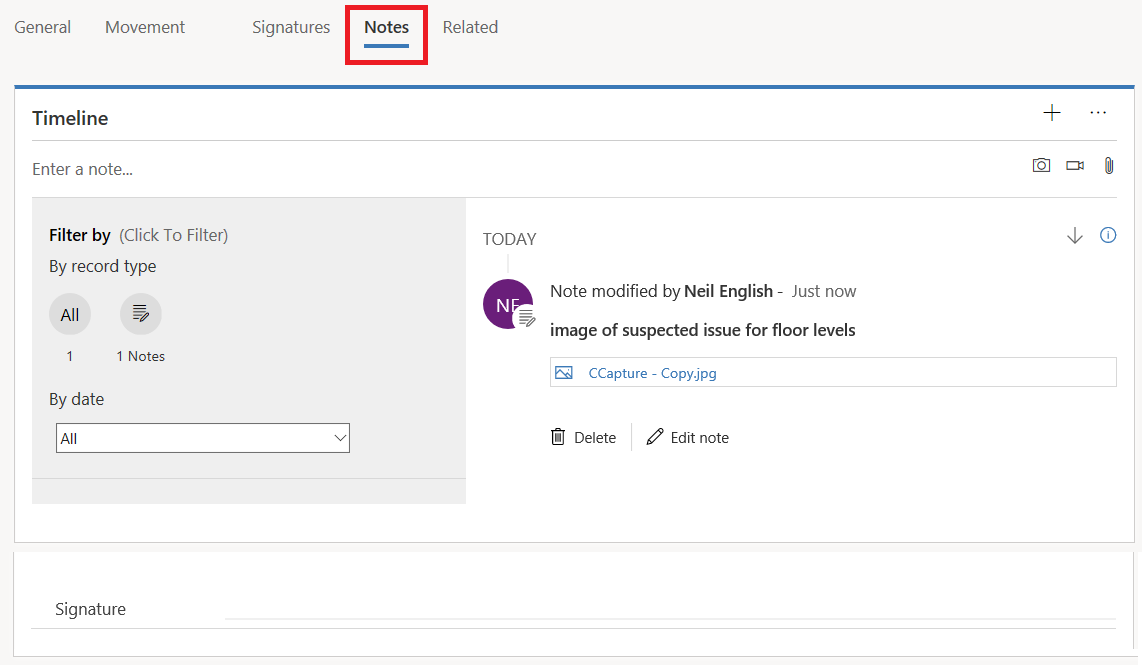
As can be seen, any changes to the answers in the “movement” section updates the Movement Score and Rating and these can then trigger various workflows for rebooking appointments, notifying specific end users or Dynamics 365 users of any High Risk Assessments and can ultimately provide a useful historical view of assessments over a time period, to display as charts and dashboards.
In the next part of this blog we will look at Input Mask customisations that can be made.